

by David Jin
Conventional wisdom says that the metric of passer rating is slowly becoming obsolete. New pass interference rules through the ages have opened up the game, and new play styles which rely on the quarterback’s rushing abilities created new avenues by which a quarterback may contribute to a team’s ability to win. These facets of the game enable highly-rated passers, like Tony Romo (who, despite ranking fifth all-time, never made the Super Bowl and won only two of six playoff games), and Kirk Cousins (who, despite ranking eighth all time, sports an even record of 40-40-2; stats accurate as of Week 9 of the 2019 NFL season), to rack up gaudy stats while never coming close to winning a Super Bowl.
Let’s take a look at the inputs to the passer rating formula. The formula’s inputs are fundamentally completions per attempt, yards per attempt, touchdowns per attempt, and interceptions per attempt. Greater rates of the first three raise passer rating, and the fourth decreases it. The perfect passer rating is 158.3 and requires no interceptions be thrown; a passer rating of zero requires no touchdowns be thrown. Throwing every single pass into the ground nets a passer rating of 39.6.
Traditionally, passer rating has had a feel to it pegged by absolute numbers. Anything over 90 is considered elite; and over 100, breaking reality. Between 80-85 is the realm of the decent, 86-89 very good. From 70-79 we have the passably mediocre, enough to hang onto a job. Anything below that is considered dreadful and probably grounds for removal. However, with rising passer ratings, this categorization is no longer possible. During the 2018 NFL season, passer rating averages rose above 90; what was elite is now plebeian.
This has been the result of several factors, notably, new passing schemes and rules to open up the passing game. The 1970s-1980s brought the Air Coryell and West Coast passing strategies, changing the mentality from “run to set up the pass” to “pass to set up the run”. Halfbacks and fullbacks started to become leading receivers, a previously unthinkable possibility. The Mel Blount Rule of 1978 codifying pass interference also contributed, with defensive players no longer able to jam receivers beyond five yards of the line of scrimmage. In 2004, the Mel Blount Rule began to be enforced more strictly in the Ty Law Rule. In 2019, replay review of pass interference was enacted, keeping defenders even more on their toes. All of these have heavily passing-friendly rules have resulted in the rise of passer ratings through the decades.
In this analysis, I will attempt to normalize passer rating by z-scoring it year-by-year, which will allow for the comparison to other quarterbacks. This means that they will be rated with respect to one another. In doing so, the environmental factors; namely, the rules and league-wide philosophies under which the quarterbacks played will be accounted for. This analysis should not be mistaken for hypothesis testing. We will not be using this statistic to test null hypotheses or create probability distributions. Rather, it is merely a tool for normalizing the players to their average.
Z-Scoring is a fundamentally simple calculation. First, get the mean of the group’s passer ratings, then get the standard deviation of the group’s passer ratings. For each player, subtract the group mean from their individual passer rating, then divide by the standard deviation. While simple, a number of assumptions need to be made. When league-wide passer ratings are calculated, every pass attempt, completion, yard, touchdown, and interception is first summed into a grand total. The passer rating formula, admittedly a byzantine and convoluted mess, is applied to this grand total. However, to compare the group means, we need to take into account individual passer ratings and cannot use a league average. Instead, we need to get the mean of the individual passer ratings, which proves difficult if there are outliers. Thus, it is necessary to set a minimum number of attempts to qualify for this analysis. I will use the NFL minimums as described by Pro Football Reference, whose data I use here. Prior to 1976, a minimum of 10 attempts per team game is required. For 1976 and 1977, a minimum of 12 attempts per team game is required. After 1978, a minimum of 14 attempts per team game (16 with the exception of the strike-shortened 1982 and 1987 seasons). As this analysis will only use data from the Super Bowl era, anything prior to 1976 will be calculated with a 14-game season. The assumption here is that by setting these minimums, we are saying that by attempting these number of passes, a player has shown us their true mean passer rating, and that their passer rating would be similar if they threw 500 pass attempts to if they threw the minimum. Another assumption is that the data are approximately normally distributed. If we look at histograms of each of the 53 seasons accounted for, this generally holds true; they look like bell curves (to be more rigorous, a Kolmogorov-Smirnov test for normality will need to be run).
Upon z-scoring the seasons of players, we get some interesting results. Only 31 of 1565 passing performances has produced a z-score over 2. Let’s discuss some of these quarterbacks’ performances. Steve Young holds the most seasons over a z-score of 2.000, with 6. He and his predecessor Montana are the only two to ever produce a single season z-score above 3.000. In the 1994 season, Young broke Montana’s record for passer rating and was named league MVP. In Super Bowl XXIX, his performance, breaking records of Montana’s, cemented his status as a winner who was a true successor of the tradition begun under Montana, and who did not need Montana to win. As he put it during the waning minutes of their 49-26 victory, “Take that monkey off my back, please!” The other single season above 3.000 came with Montana’s 1989 season, which also culminated in a Super Bowl victory, in which the 49ers decimated the Denver Broncos 55-10. Montana won league MVP and Super Bowl MVP, capping off a season for the ages. Montana had another season in which he cracked the 2.000 mark, his 1984 season, in which he led the 49ers to victory in Super Bowl XIX. Indeed, this metric shows just how much the 49ers were the most dominant passing team in their era, and how much the West Coast Offense changed the zeitgeist of the NFL.
The next player on the list if Aaron Rodgers, with his 2011 z-score of 2.962. During this season, Rodgers won MVP, set the single-season record for passer rating, and led his team to a 15-1 regular season record, but bowed out with a loss to the eventual champion New York Giants in their first postseason game. Rodgers has three seasons with a z-score above 2.000. The fourth player on the list, Kurt Warner, had a z-score of 2.865 in 1999. This was his first season as a starter, a fairy tale in which he took the Greatest Show on Turf to a victory in Super Bowl XXXIV. He would be named MVP and Super Bowl MVP. Warner has two seasons with a z-score above 2.000, the 1999 season and the 2001 season.

There is a high correlation between passer rating z-score and not only winning percentage (363-92, 0.798), but playoff success between these players (41-22, 0.651). The only team to not have made the playoffs was the 1991 San Francisco 49ers, who still managed to log double-digit wins with a 10-6 record. Among them, they have participated in 13 of the 53 Super Bowls played thus far, and one Super Bowl, XIX, featured two of them, when Dan Marino faced Joe Montana. They have also been awarded 16 MVP awards, and in two of these seasons, two quarterbacks had passer rating z-scores above 2.000. In each of these seasons, one of the quarterbacks won MVP while the other did not; if the performance would have occurred in another season in which there were no passer rating z-scores above 2.000, it is quite possible that they would have won MVP as well, bringing the award total up to 20.
On the converse, the stories of the worst single season z-scores are also quite telling. No quarterback has logged multiple seasons of a z-score under -2.000, nearly all which have resulted in an atrocious regular season win percentage (0.291). Of particular irony is how Peyton Manning has put up some of the greatest passer rating z-scores in NFL history and one of the worst z-scores.

Looking at the quarterbacks who have logged a z-score less than -2.000, storylines about quarterback ineptitude emerge: DeShone Kizer leading the 2017 Browns to a winless season; Ryan Leaf cementing himself as the greatest draft bust of all time; and Akili Smith, Rick Mirer, and JaMarcus Russell giving Leaf a run for his money. The win-loss record for quarterbacks with a z-score less than -2.000 is 94-229, for a paltry 0.291 win rate.
Peyton Manning’s 2015 season, one of the worst z-scored passer ratings in the Super Bowl era, is a prime example of how z-scoring reveals storylines otherwise hidden by raw passer rating. In this season, Manning won the Super Bowl, the only starting quarterback to ever do so with a z-score less than -2.000. This is because the Broncos sported a historically talented defense, with all of their four Pro Bowlers being star defensive players: LB and eventual Super Bowl MVP Von Miller, LB DeMarcus Ware, CB Chris Harris Jr., and CB Aqib Talib. They were a well-constructed team, with the Ware and Talib signings the feathers in the cap of GM John Elway. Getting rid of perennially underachieving head coach John Fox, and bringing in perennially underappreciated head coach Gary Kubiak, the Broncos’ organization set the tone for a magical season.
Besides Manning, the only other player whose team made the playoffs with a z-score less than -2.000 is Kyle Orton, in 2005. Again, Orton’s team was backed by a defense with five Pro Bowlers, Hall of Fame LB Brian Urlacher, LB Lance Briggs, DT Tommie Harris, CB Nathan Vasher, and SS Mike Brown. The lone offensive Pro Bowler on the 2005 Bears, C Olin Kreutz, who anchored an offensive line that was able to push through 2,099 team rush yards, good for eighth in the league, with Thomas Jones’s 1,335 rushing yards and 9 touchdowns leading the way. In the era of the mid-2000s, the Bears did not need a passing game when their run game and defense were so dominant (Fun fact: the leading passing team that year? The Arizona Cardinals, with Kurt Warner putting up 2,713 yards, Josh McCown putting up 1,836, and Josh Navarre putting up 174).
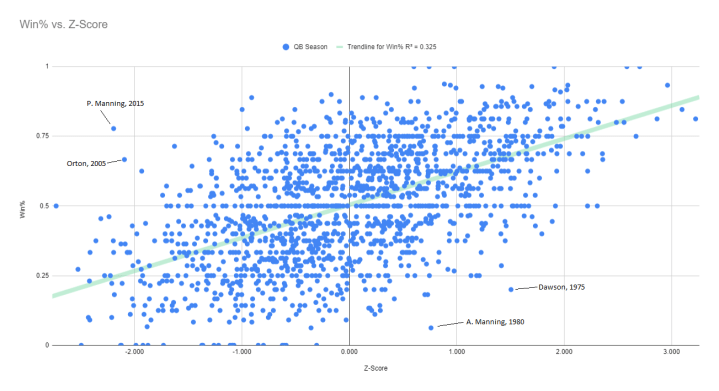
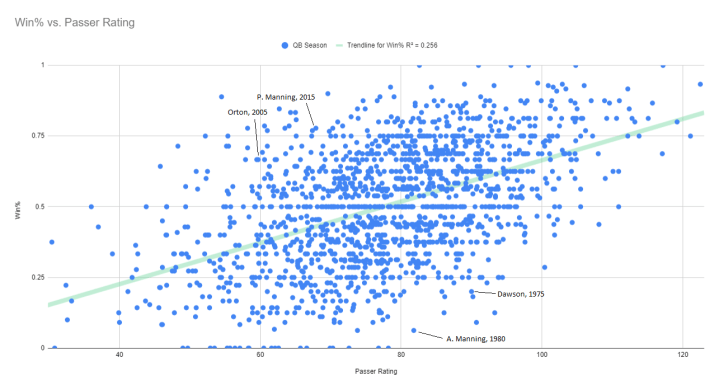
On a scatterplot relating the z-scores of every single qualifying quarterback season in the Super Bowl era and their win percentage, Manning and Orton stand out as major outliers, with excellent team records despite horrible individual performance; on a chart using raw passer rating, their storylines are far less apparent. Conversely, the scatterplot of the z-scores also shows quarterbacks whose teams performed poorly despite excellent individual performance. Before Peyton Manning’s atrocious passing season resulted in a Super Bowl victory, his father’s above-average 1980 season was tanked by a defense that allowed 6,218 yards, 28 rushing touchdowns, and 31 passing touchdowns, the worst in the league. The offense scored 291 points, the defense allowed 487 points, and the A’ints stumbled to a 1-15 record. Len Dawson’s 1975 season was tanked by the second-worst defense in the league, allowing 5,236 yards, 24 rushing touchdowns; their 18 passing touchdowns allowed, while a tiny sum today, was eighth-worst in the league. Only the hapless Jets had a worse defense, and Joe Namath’s gunslinging manner caused him to lead the league in interceptions, appropriately dropping his z-score. Again, the seasons of Manning and Dawson are not as apparent in a scatterplot of raw passer rating.
Lastly, us take a look at the R-squared value of the two scatterplots. In this situation R-squared is the proportion of the variance of win percentage that can be accounted for by passer rating z-score in the first chart, and raw passer rating in the second. The R-squared value of the z-score vs. win proportion chart is greater than that of the raw passer rating vs. win proportion chart (0.325 vs. 0.256), indicating that the z-scored passer rating accounts for a greater proportion of the variance compared to raw passer rating. As football is a multi-dimensional, multi-platoon game, there is still much attributable to other variables that might not be listed (0.675 of the variance for z-scored passer rating, 0.744 for raw passer rating).
Despite calls for its modification or discontinuation, passer rating remains a valuable tool in determining a quarterback’s contribution to a team’s performance, and discrepancies between a quarterback’s passer rating and the team’s performance can be explained by other variables behind a team’s performance. As passer ratings rise due to rules changes, normalizing that passer rating through z-scoring can provide us with further insight into a quarterback’s abilities. Z-scoring exhibits quarterbacks’ abilities to lead the team to victory—or, more strikingly, his team’s ability to overcome his deficiencies as a passer.
Many thanks as always to Pro Football Reference for the statistics used in this analysis.
